Just the most important ones.
AngularJS is a structural framework for dynamic web apps. It lets you use HTML as your template language and extend HTML's syntax to express your application's components clearly and succinctly. Angular's data binding and dependency injection eliminate much of code you would otherwise have to write.
Elasticsearch is a distributed, open source search and analytics engine, designed for horizontal scalability, reliability, and easy management. It combines the speed of search with the power of analytics via a sophisticated, developer-friendly query language covering structured, unstructured, and time-series data.
Kibana is an open source data visualization platform that allows you to interact with your data through stunning, powerful graphics. From histograms to geomaps, Kibana brings your data to life with visuals that can be combined into custom dashboards that help you share insights from your data far and wide.
C3 makes it easy to generate D3-based charts by wrapping the code required to construct the entire chart. We don't need to write D3 code any more. C3 provides a variety of APIs and callbacks to access the state of the chart. By using them, you can update the chart even after it's rendered.
GitHub is a web-based Git repository hosting service. It offers all of the distributed version control and source code management functionality of Git. It provides access control and several collaboration features such as bug tracking, feature requests, task management, and wikis for every project.

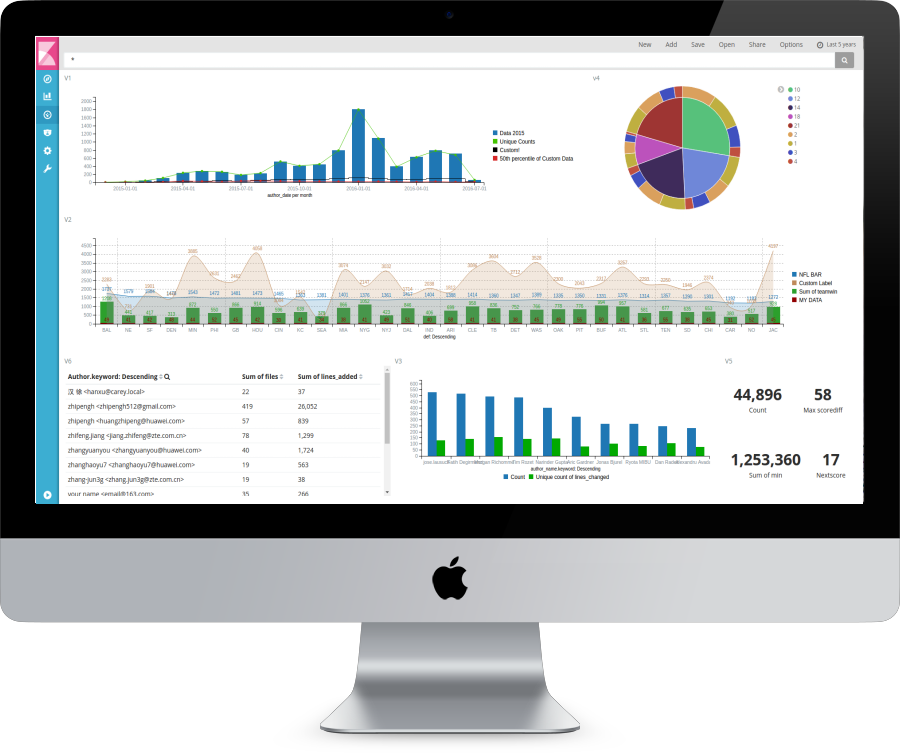
This plugin will help you to create a stunning charts. Check out some of the fuatures below.
A live demo of the plugin is uploaded to a website and you can try it right now.
Live DemoDownloadable PDF file of my degree thesis just in case you want to learn more about it.
Download PDFGitHub repository where you can download the plugin and follow the install steps.
Check out
Developer